Description
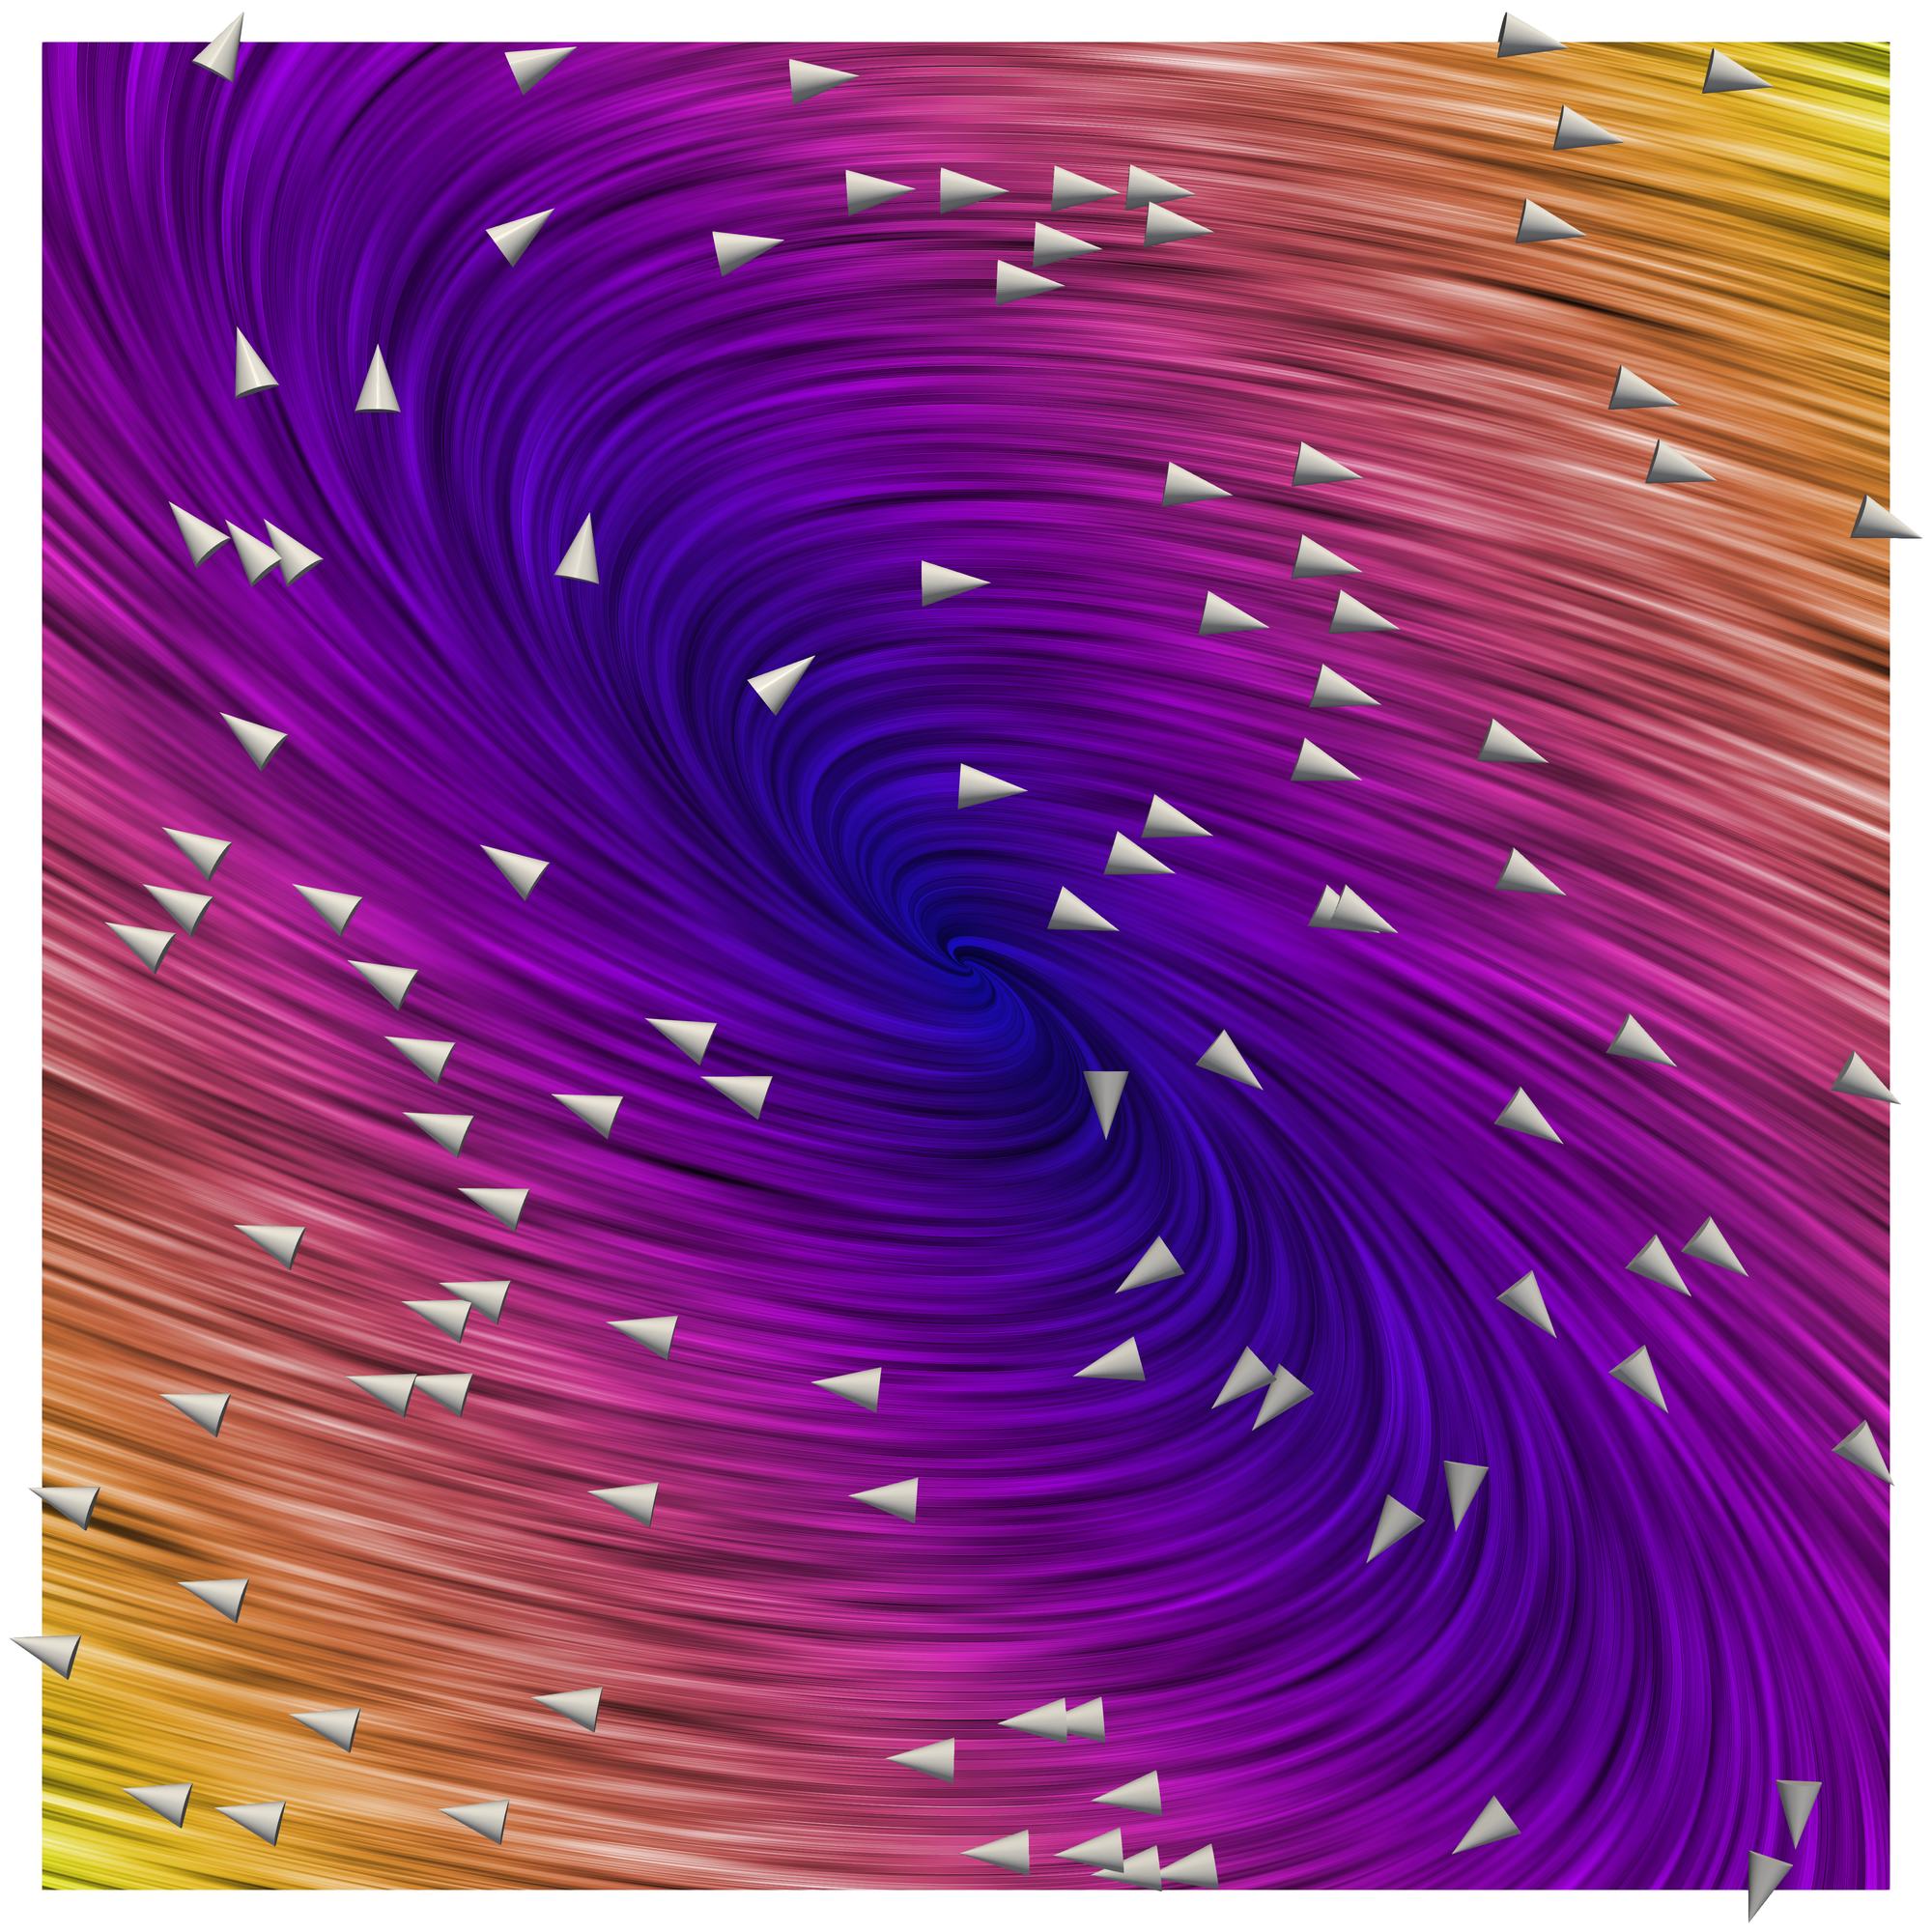
LIC visualization of the Linear Flow with magnitude coloring, depicting a saddle point with complex eigenvalues.
VCG Plugins used for this Image
Paraview Plugins used for this Image
Glyph, OutlineFilter, TubeFilter, VCG - LinearField2D
Dataset(s) used for this Image